Default UI Menu: Tools/Database/Report
Ribbon UI Menu:
- The Reports window now shows the report you have just created. (You can return to the Reports window anytime by selecting Tools / Database / Report.) Click Report.
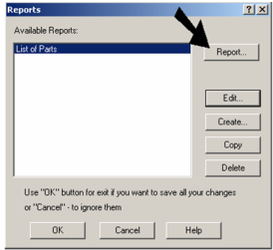
-
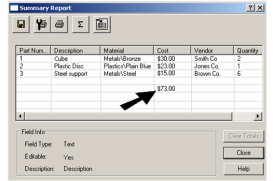
The Summary Report window shows the fields and values that will go in the report. If you want to re-order a column, drag its header to the new location. You can also click on a header to change that column's sorting order. To add a row for cost sums, click in a cell below the last "Cost" items.
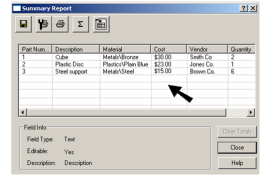
-
Then click Grand Total.
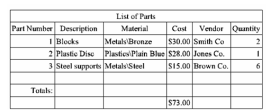
The sum of the cost items is now listed.
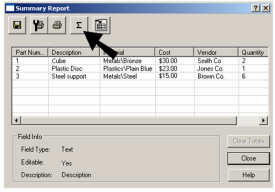
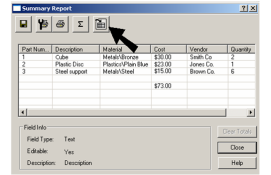
The other available options at the top of the Summary Report window are: Export: Saves the report as a Microsoft Excel Spreadsheet (XLS), Microsoft Access Database (MDB), a Comma Separated Value (CSV), or a Tabbed Text File (TXT). Page Setup: Sets the format of a printed version of the report. You can add the page number, number of total pages, date, and/or time to the header or footer of each report page. You can also set the margins, alignment, page order, and scale of the report pages, and whether grid lines, row headings, and column headings will be printed. Print: Prints the report using the Print Setup options.
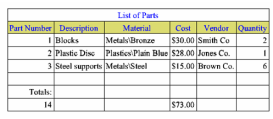
- To place the report in the file, click Insert Table into the Drawing.
- In the Insert Table window, set the sizing options for rows and columns. You can also set the table style here.
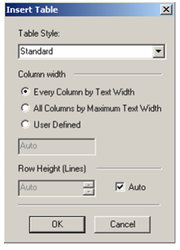
- Click to place the report as a table in the drawing.
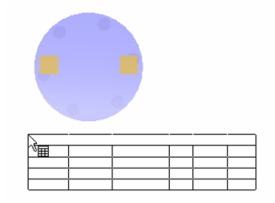
The table contains the custom fields, as well as the Materials field.
Note: If you want to edit or add text to a table, . For other changes such as adding or removing rows / columns, or merging cells
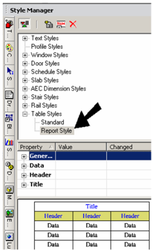
- If you want to change the style of the report table, make sure the style is defined under Table Styles in the Style Manager.
- The style is assigned to the table in the General page of its Properties.
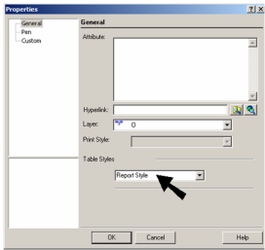
If you change the style, the table will update automatically.