Progress Over Time
The Progress Over Time report charts your student’s specific progress through the program’s quizzes and tests. To review this report, click Progress Over Time at the top of the Reports screen from the Summary, Keyboard Proficiencies, or Curriculum Map reports.
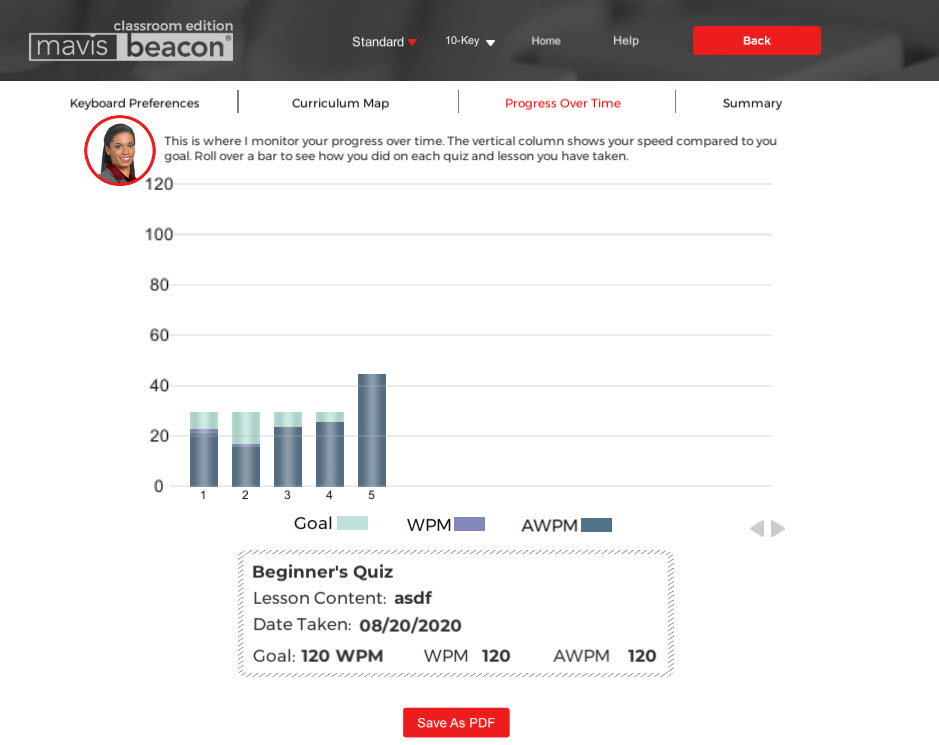
This screen displays the results of your student’s quizzes and tests from the first to the most recent, with each column representing a different quiz or test. Move your pointer over the column for specific information about a quiz or test and your student’s performance on it.
The colors on the Progress Over Time graph represent information from different areas of your student’s progress. The Blue columns represent Lesson Area quizzes and Keyboard Proficiencies tests. The light-blue, purple, and dark-blue segments of these columns correspond to Goal (light blue), WPM (purple), and AWPM (dark blue). The Brown columns represent Speed Test tests. The tan, orange and medium-brown segments of these columns correspond to Goal (tan), WPM (orange), and AWPM (medium-brown).
The columns appear completely dark blue or medium brown when the results for your student’s AWPM, WPM, and goal are the same value. For example, you set your student’s goal at 40 WPM, and then your student types 40 WPM without making errors so your student’s AWPM is also 40.
You can view a student’s Progress Over Time report in Standard and 10-Key modes. In the first mode, information is listed in WPM. In the second, it’s listed in KPM. Use the toggle keys to switch between the different modes and view the two reports.
From the Progress Over Time report, you can also click Print to print just the Progress Over Time portion of the student progress reports. See the Printing Student Progress Reports section for more information about this process.