Database Connection Palette
(Available in XT Pro)
Default UI Menu: Tools/Palette/Database Connect
Ribbon UI Menu:

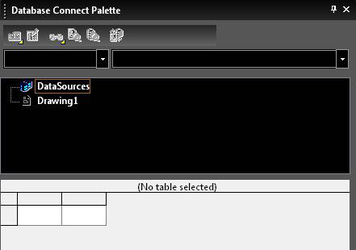
DoubleCAD has the ability to connect to a database and associate the data with objects. Database connectivity and management is handled through the Database Connection Palette.
To Create a Database Connection:
-
Open the Database Connection Palette.
-
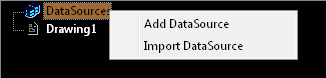
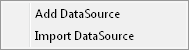
Right click on the DataSources icon and click Add DataSource.
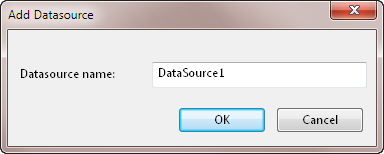
- In the Add Datasource dialog type in the name of the new datasource and click OK.
-
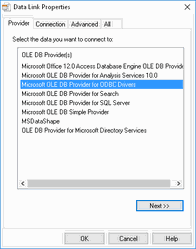
The Data Link Properties dialog will open.
-
On the Provider page select the appropriate OLE DB Provider type for the datasource to which you wish to connect. Then click Next.
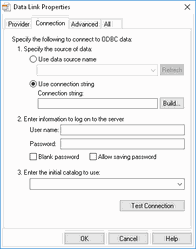
- The Connection page will appear.
-
Specify the database source. or
-
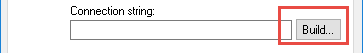
Use connection String
1. Click Build
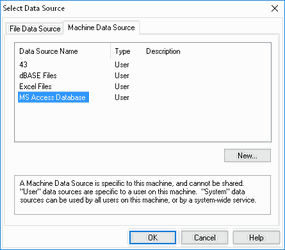
2. Select a File Data Source or Machine Data Source
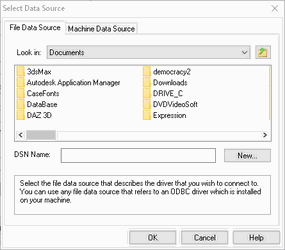
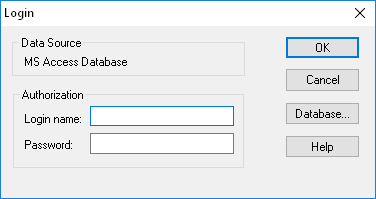
3. Set login info if needed, then press OK.
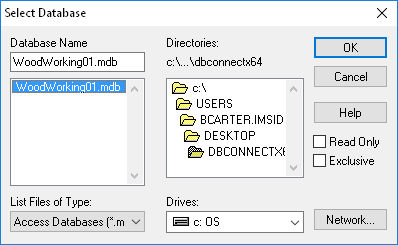
4. Select the Database.
-
Setup the Server login information.
-
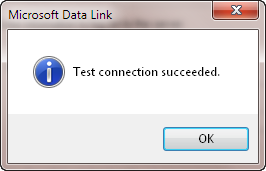
Click the Test Connection button. If the connection is valid the Test Connection Succeeded message will appear.
-
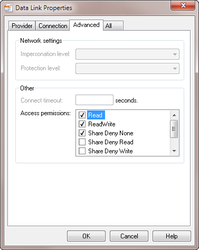
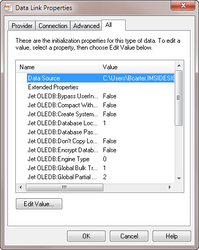
At this point you can move on to the Advanced and All pages, or click OK.
-
The features and functions of the Advanced and All pages are network and database specific, and are dependent upon your network and OBDC/OLE DB protocols. Only a person and experienced with your network and database protocols should alter these settings.
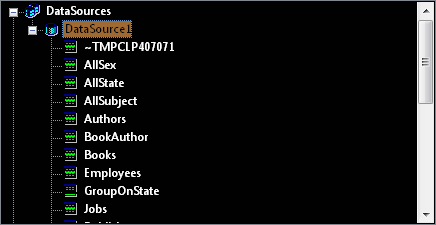
- After these operations you will see a new datasource object in DataSources tree.
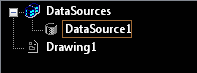
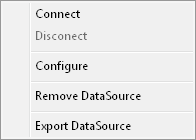
- The datasource is not yet connected. Right-click on the datasource and select Connect.
-
Your database is now connected to DoubleCAD as a datasource.
-
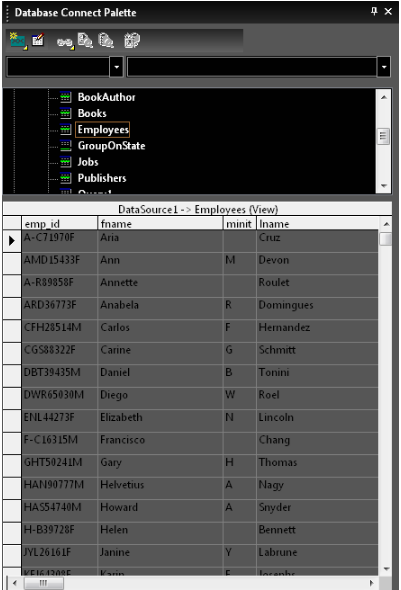
When connected a datasource shows all available tables and views in database.
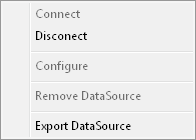
To Disconnect a Datasource:
-
Select a connected datasource in the DataSources tree.
-
Right-click on the datasource and select Disconnect.
To Re-configure a Datasource:
-
Select a datasource in the DataSources tree.
-
Right-click on the datasource and select Configure. This will open the Data Link Properties dialog.
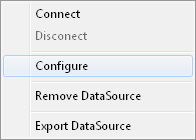
- Make the required changes and click OK.
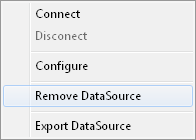
To Remove a Datasource:
-
Select a datasource in the DataSources tree.
-
Right-click on the datasource and select Remove DataSource.
-
You will be prompted with a warning dialog.
-
If you are clear to proceed click Yes.
To Export a Datasource:
-
Select a datasource in the DataSources tree.
-
Right-click on the datasource and select Export DataSource.
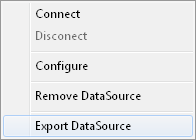
- This will open Save As dialog.
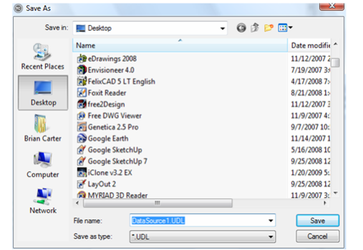
- Select a location and name for the datasource, and then click Save.
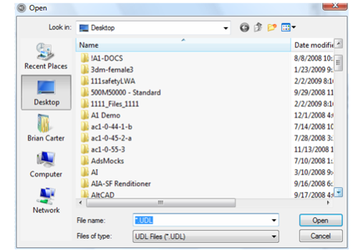
To Import a Datasource:
- Right click on the DataSources icon and click Import DataSource.
- This will start the Open dialog.
Note: Connect is only available when a datasource is disconnected. Disconnect is only available when a datasource is connected.
Creating Data Link Templates
In order to connect data from tables to graphic objects it is necessary to create Link Templates. Link templates set a pattern that defines which the data elements will be linked from the table and associated with designated graphic objects. To Create a New Link Template:
- Select a table in the DataSources tree.
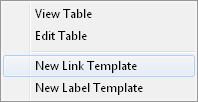
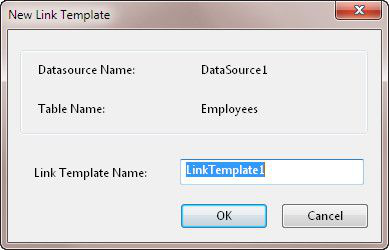
- Right-click and select New Link Template, or click the . The New Link Template dialog will appear.
- Type in a name for the link template, and then click OK.
-
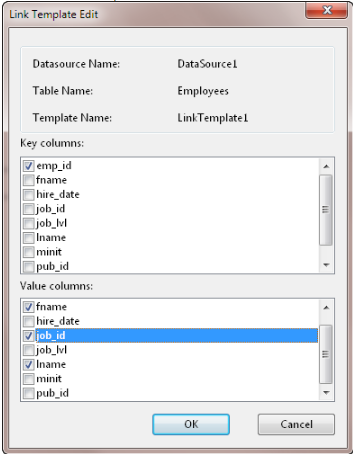
The Link Template Edit dialog will appear.
-
Select the Key Columns. These are used to define link information data for linked graphics.
-
Select the Value Columns. These values will be set as custom properties of the object.
-
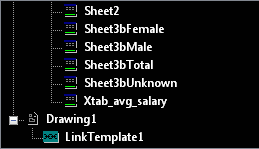
The created link template will be attached to current active drawing.
To Edit a Link Template:
- Select the template in the DataSources tree.
- Right-click and select Edit. The Link Template Edit dialog will appear.
- Make the required changes, and then click OK.
To Remove a Link Template:
-
Select the template in the DataSources tree.
-
Right-click and select Delete.
Warning: The link template will be immediately deleted. Removing a link template leads to removing all graphic links bound to it.
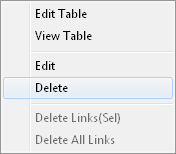
- You will be prompted to confirm the deletion.
Linking Data to Graphics
Data is linked to graphics by connecting a table to specific graphics via link templates. To Connect Data to Graphics:
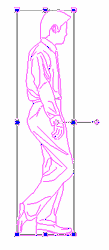
- In a drawing, select one or more graphics.
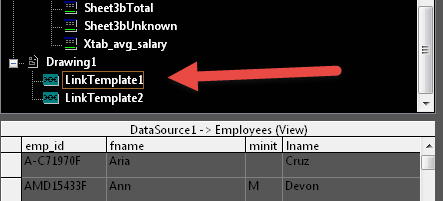
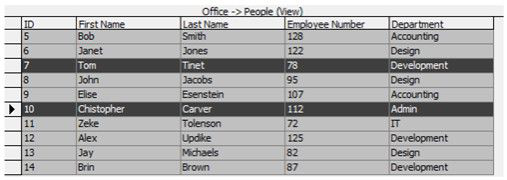
- In the DataSources tree, double click on the desired table to select it for linking. This will also open the view of the table in the lower frame of the palette.
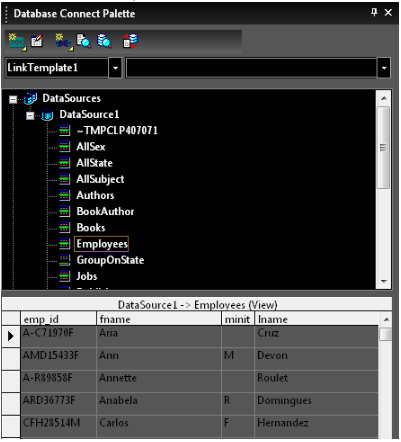
- In the table view, in the lower frame of the palette, click on the record you wish link.
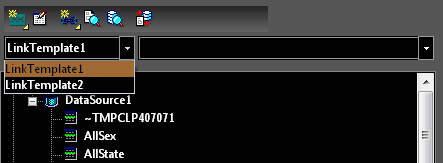
- Use the Link Template drop-down box located on the palette toolbar to select the desired link template.
- Click the Create Link button on palette toolbar.

-
The link between the selected graphics and the table record is created.
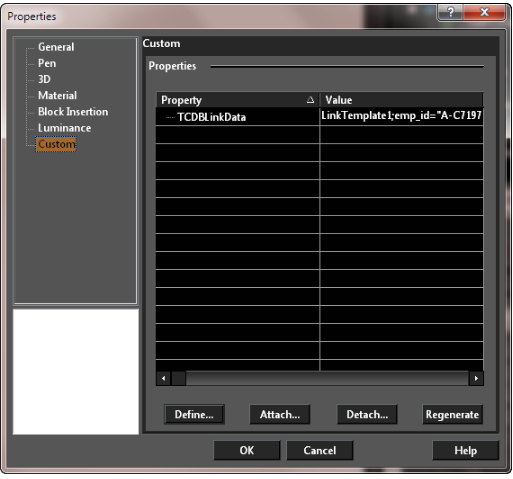
-
Go to the Custom Properties of the object to verify the link.
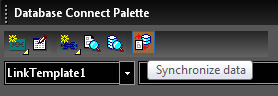
Synchronizing Data and Graphics
To get data into linked graphics it is necessary to synchronize the data. The synchronizing process copies data from the datasource into all linked graphics and places it in the custom properties of linked graphics. To Synchronize Data:
- Click the Synchronize Data button on toolbar to run synchronizing process.
- Verify that the data has been synchronized by opening the properties of a graphic that is linked and going to the Custom page.
To Remove Links from Selected Graphics:
-
Select the graphic/s you wish to de-link.
-
In the DataSources tree select the link template you wish to de-link from the graphic/s.
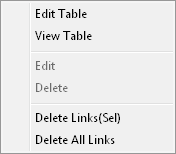
- Right-click and select Delete Links(Sel).
-
Synchronize the data.
-
The links and data have been removed.
To Remove All Links to a Link Template:
- In the DataSources tree select the link template you wish to de-link.
- Right-click and select Delete All Links.
-
Synchronize the data.
-
The links and data have been removed.
To Find Graphics Linked to the Datasource:
-
Select the datasource.
-
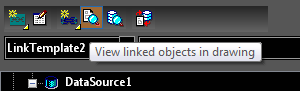
Click the View linked objects in drawing button on palette's toolbar.
-
Right-click and select Find Graphics.
To Find Table Record Linked to a Selected Graphics:
-
Select a graphic.
-
Click the View linked records in dataview button on palette's toolbar.
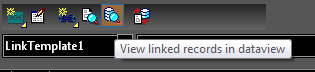
- All records which are linked to the selected object will be highlighted in the table view.
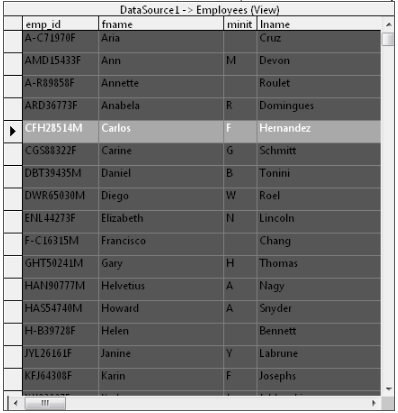
Viewing and Editing Data in Tables
When connected a datasource shows all available tables and views in database. Available tables and views appear as child nodes of the datasource.
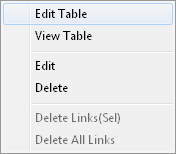
To Show a Table's Content:
- Select the table in the DataSources tree.
- Right-click and select View Table, the table will be opened in the lower frame of the Data base Connection palette in Read-Only mode.

To Edit a Table's Content:
- Select the table in the DataSources tree.
- Right-click and select Edit Table, the table will be opened in the lower frame of the Data Base Connection palette in Edit mode.

(Available in XT Pro)
Default UI Menu: Tools/Database
Ribbon UI Menu:

All properties of objects are elements of a database. Standard database property items include line width, color, coordinates of points that comprise the object, etc. The database management feature enables you to add information to objects and to create reports using this information. For example, you can add custom fields to provide information on suppliers, manufacturers, price, etc. The information can then be presented as a Bill of Materials, Parts List, or other type of report. Database management and report creation generally follows these four steps:
- Step 1: Define Custom Fields
- Step 2: Attach Custom Properties to Objects
- Step 3: Define Fields for the Report
- Step 4: Create the Report
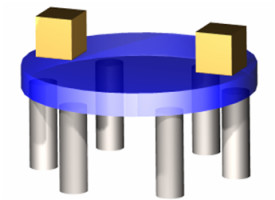
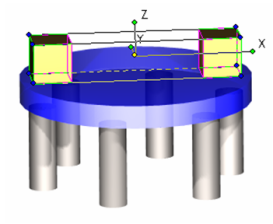
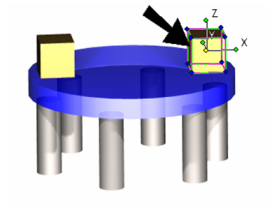
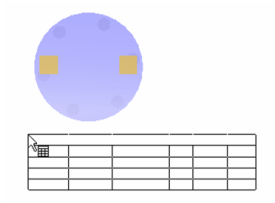
The following example shows how to create some custom properties, then create a report from the custom and standard properties. The objects in the report are shown below: a large plastic disc, two cubes on top, and six steel cylinders below.
Step 1- Define Custom Fields
Default UI Menu: Tools/Database/Define Fields
Ribbon UI Menu:

The first step in creating a database is to define the types of information to be recorded.
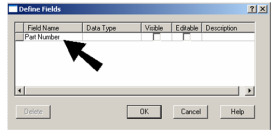
- Select Define Fields. In the DefineFields window, enter the first property: "Part Number."
- Fill in the remaining fields in this row
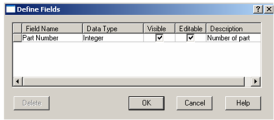
Data Type: Text: Alphanumeric information which does not have to be calculated. Integer: Whole numbers. Double: Decimal numbers. Currency: Dollar amounts. This type will not appear in an object's Custom page of the Properties window. Visible: If checked, the field will be visible and available for use in the Edit Object Data and Report windows.
Tip: If you know you will not be using certain fields in reports, it is helpful to turn off visibility.
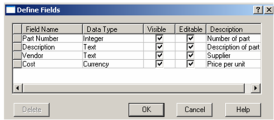
Editable: If checked, the field can be edited in the other database dialogs. Auto fields are always non-editable. Description: An optional field for notes or other comments.
- To add the next property to the database, click in the first empty field under Field Name, and type the new field name. This example uses "Description," Vendor," and "Cost." Then continue to fill in the other fields.
Note: To delete a record, click the square at the beginning of a row, and select Delete.
- Click OK when the custom properties are defined.
Step 2- Attach Custom Properties to Objects
- Select the object whose custom properties you want to define. If multiple objects have the same custom properties, such as the cubes below, select them all.
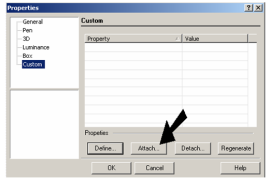
- Open the Properties to the Custom page. Click Attach at the bottom of the window.
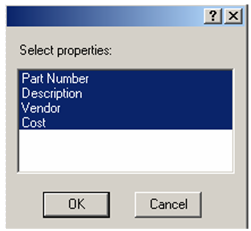
- Select all of the custom properties and click OK.
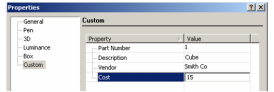
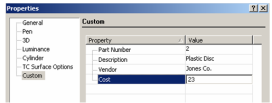
- Now the properties appear on the Custom page. Fill in the Value for each part.
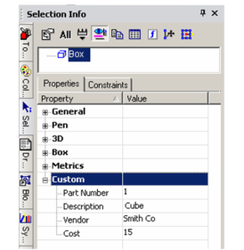
You can also enter or change custom properties in the Selection Info palette.
- The previous values were for the two cubes (Part Number 1); the values below are for the large disc (Part Number 2).
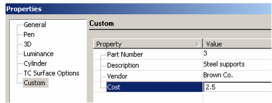
- These values are for the six support cylinders (Part Number 3).
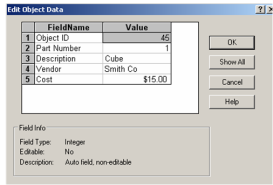
- To verify that the custom properties were properly attached, select one of the objects.
- Then select Tools / Database / Edit Object Data. You can update values in this table, if needed.
Step 3- Define Fields for the Report
Default UI Menu: Tools/Database/Report
Ribbon UI Menu:

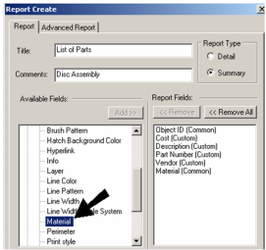
- To begin defining the report, select Tools / Database / Report. Then click Create.
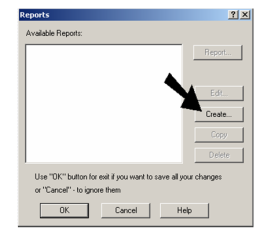
- Enter a report Title and Comments (optional). If you choose Detail, only values from editable fields may be edited before the report is created. With Summary, all values may be edited before printing, even if they come from a non-editable field.
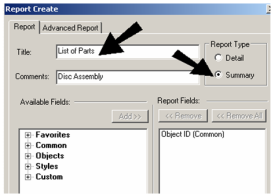
Note: "Object ID" is a unique identifier, and is generated automatically when attaching fields to objects.
- The custom fields appear under the "Custom" category. Click the "plus" sign to expand this category.
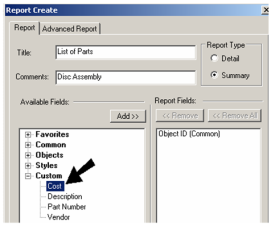
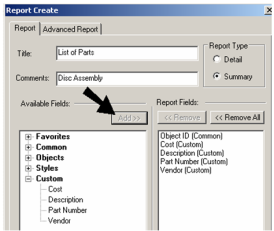
- For each field you want to appear in the report, click it under Available Fields, then click the Add button. The field should then appear under Report Fields. Repeat these steps for each of the custom fields.
Note: If you have block in your drawing with attributes you can add those attributes to your report.
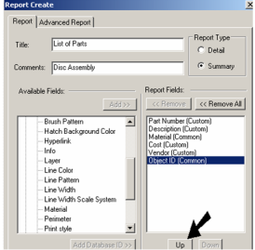
- Non-custom (standard) fields can also be added to a report. In this example Material is added, and Material is found in the "Common" category.
You do not have to create a report using custom fields; reports may contain only standard fields.
- The order of the Report Fields list is the order that will in the report. To change the order, highlight the field you want to move and click Up or Down. (You will also be able to change the order later.)
- You can use a query if you want to filter the objects to be included in the report. If you want to run a query, click Edit. Otherwise, all objects in the model will be scanned while creating the report.
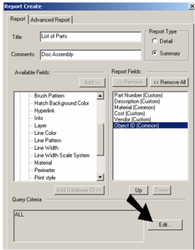
An example of a query in this example would be to search for objects that have "Part Number" fields greater than one. This is how the syntax would look:
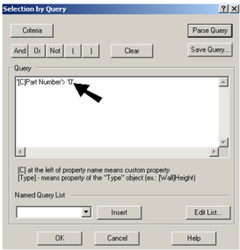
-
If you created a query, click OK to return to the Report Create window.
-
Open the Advanced Report table.
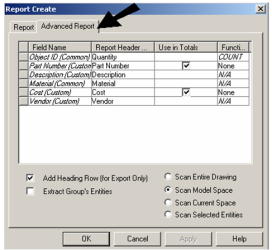
The appearance of this tab depends on whether you are creating a Detail or Summary report. For a Detail report, Field Names can be edited. For a Summary report, Report Header Names may be edited.
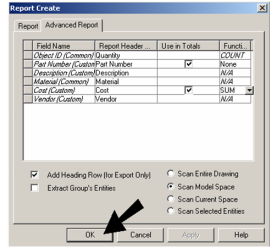
- For the "Copy" row, click the cell in the Function column. From the drop-down menu, select SUM. This will show the total cost of all objects, not the unit price per object.
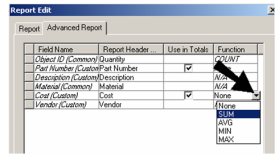
The other function options are AVG which calculates the average of all values, and MIN / MAX which displays the smallest or largest of the values.
- When all fields and queries are defined, click OK to return to the Reports window.
Step 4- Create the Report
Default UI Menu: Tools/Database/Report
Ribbon UI Menu:
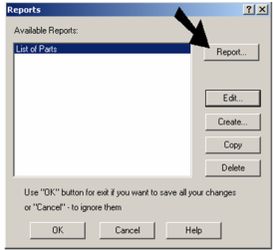
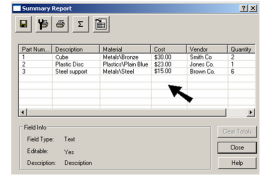
- The Reports window now shows the report you have just created. (You can return to the Reports window anytime by selecting Tools / Database / Report.) Click Report.
-
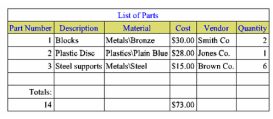
The Summary Report window shows the fields and values that will go in the report. If you want to re-order a column, drag its header to the new location. You can also click on a header to change that column's sorting order. To add a row for cost sums, click in a cell below the last "Cost" items.
-
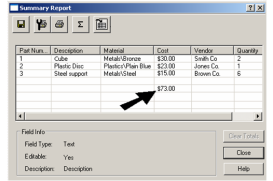
Then click Grand Total.
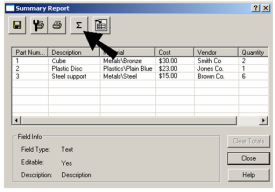
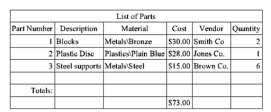
The sum of the cost items is now listed.
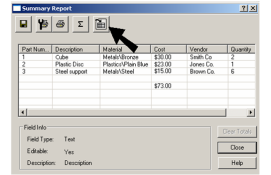
The other available options at the top of the Summary Report window are: Export: Saves the report as a Microsoft Excel Spreadsheet (XLS), Microsoft Access Database (MDB), a Comma Separated Value (CSV), or a Tabbed Text File (TXT). Page Setup: Sets the format of a printed version of the report. You can add the page number, number of total pages, date, and/or time to the header or footer of each report page. You can also set the margins, alignment, page order, and scale of the report pages, and whether grid lines, row headings, and column headings will be printed. Print: Prints the report using the Print Setup options.
- To place the report in the file, click Insert Table into the Drawing.
- In the Insert Table window, set the sizing options for rows and columns. You can also set the table style here.
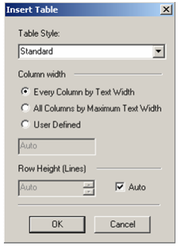
- Click to place the report as a table in the drawing.
The table contains the custom fields, as well as the Materials field.
- If you want to change the style of the report table, make sure the style is defined under Table Styles in the Style Manager.
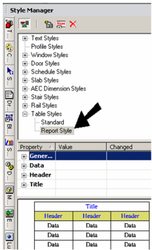
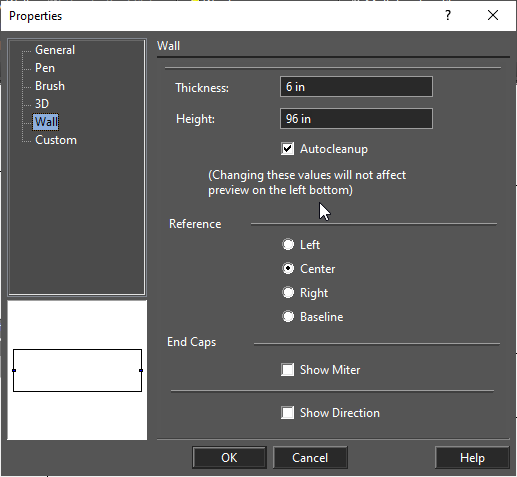
- The style is assigned to the table in the General page of its Properties.
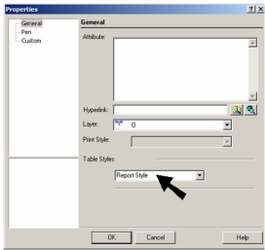
If you change the style, the table will update automatically.